Research + Design + Outreach (2020)
Geospatial Analysis of the Socio-Economic Impact of COVID-19
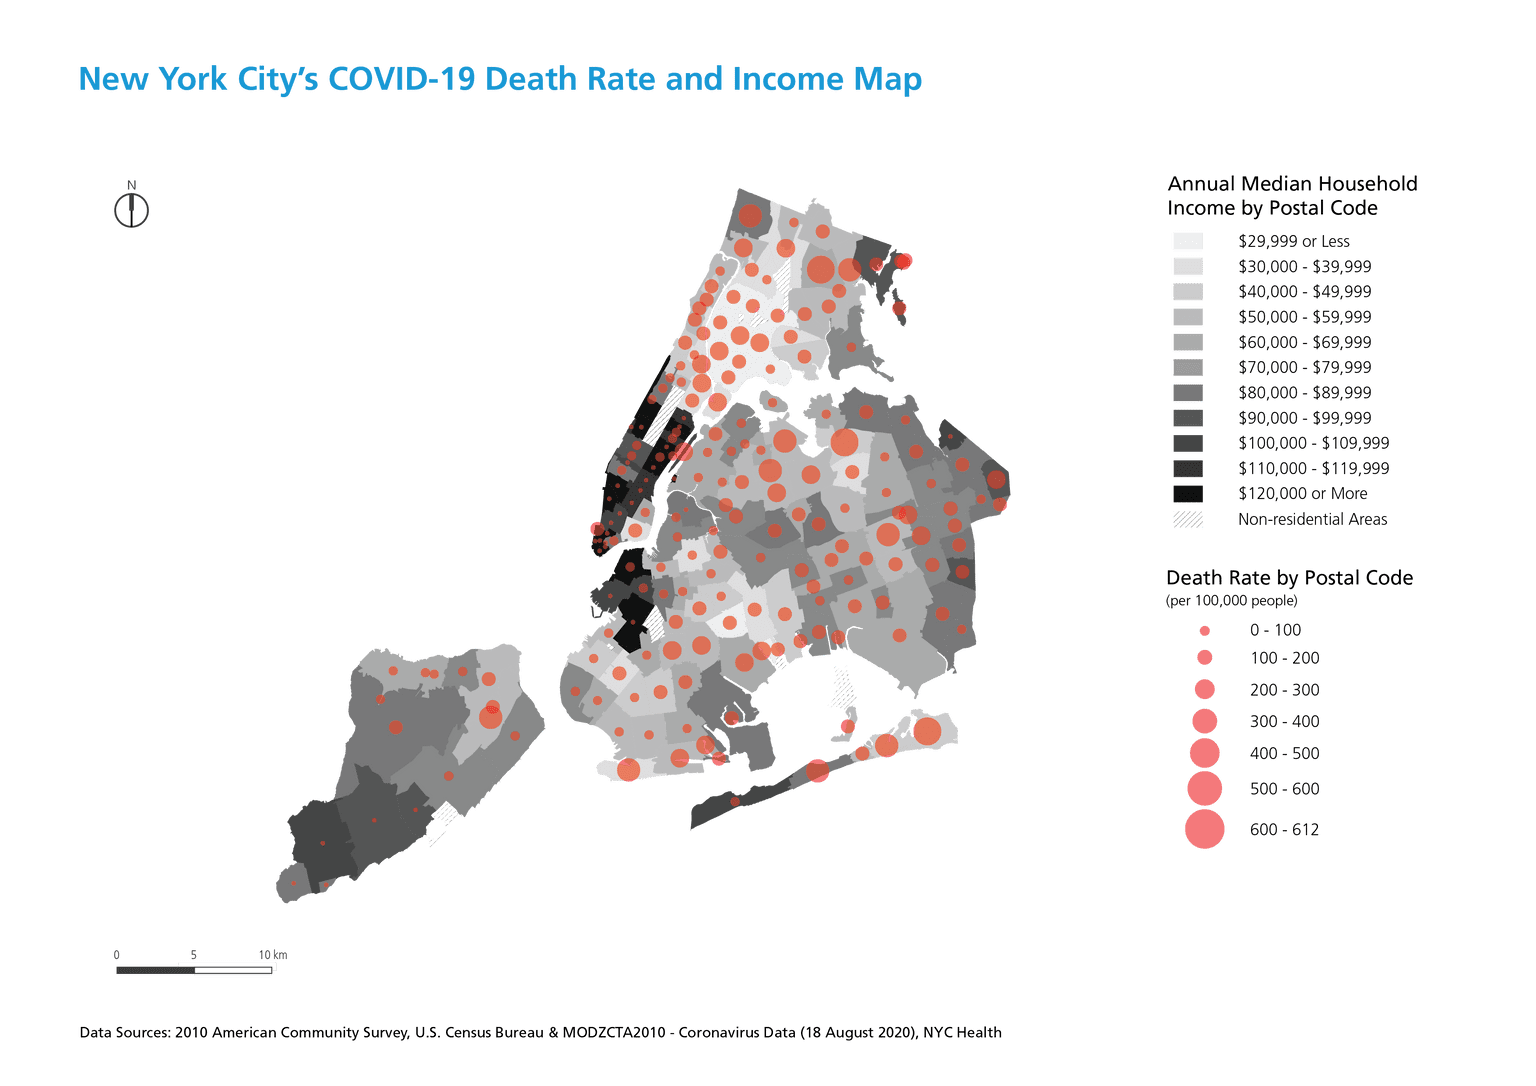
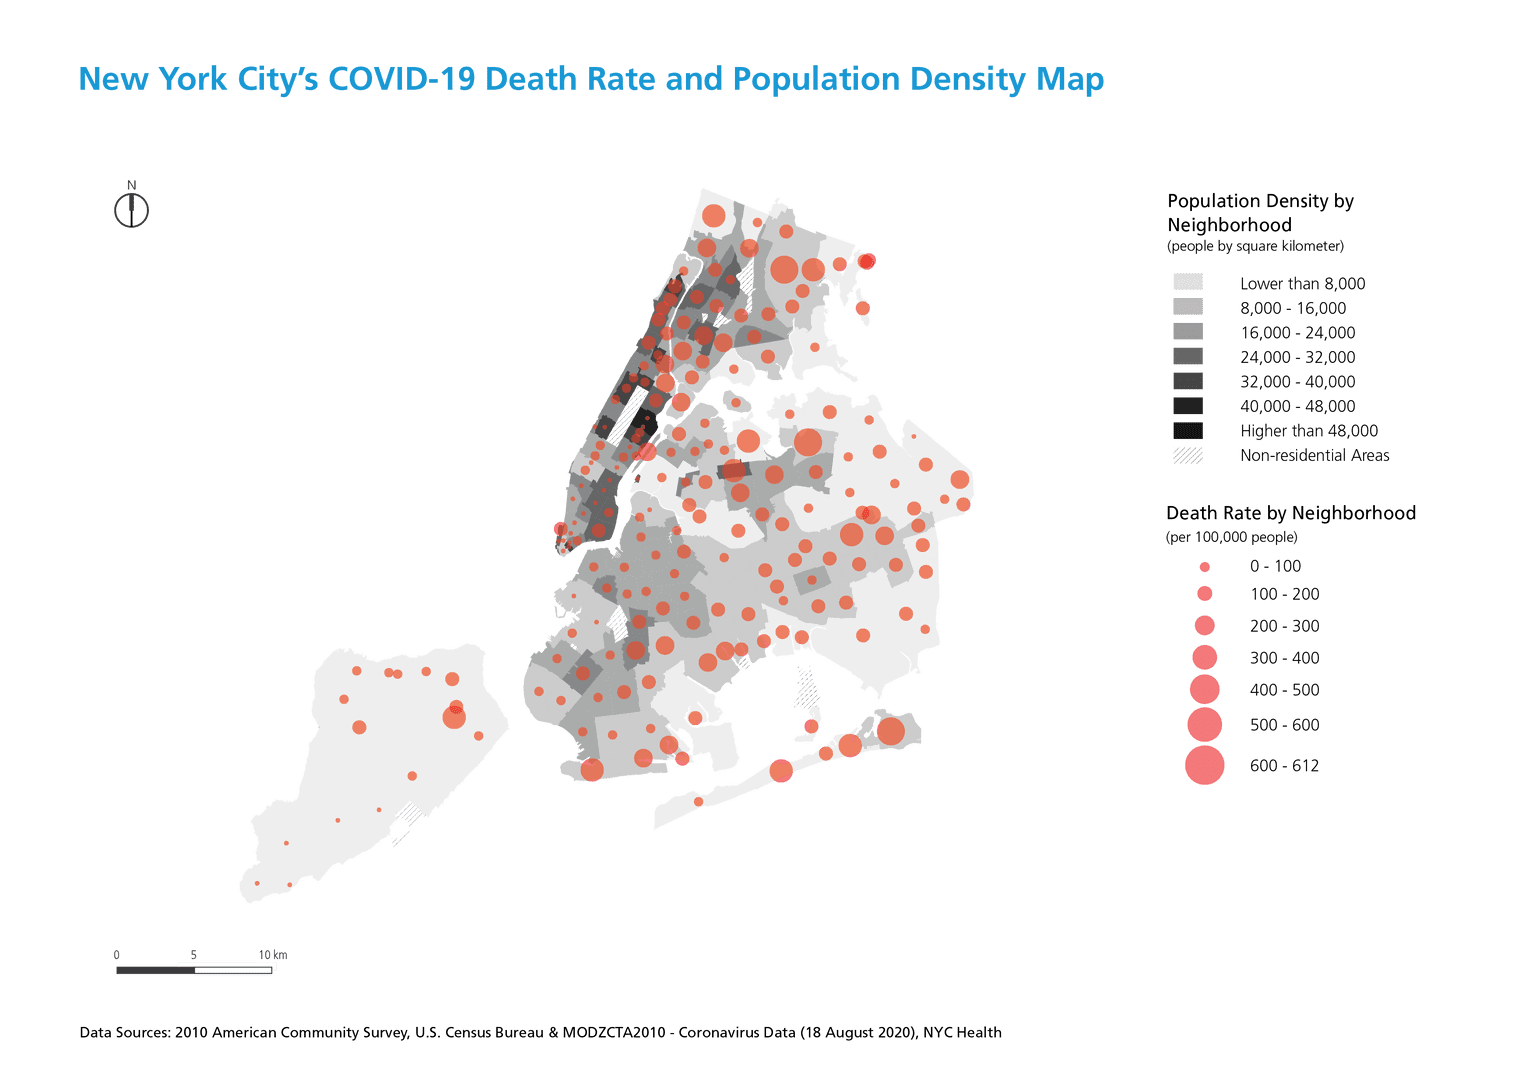
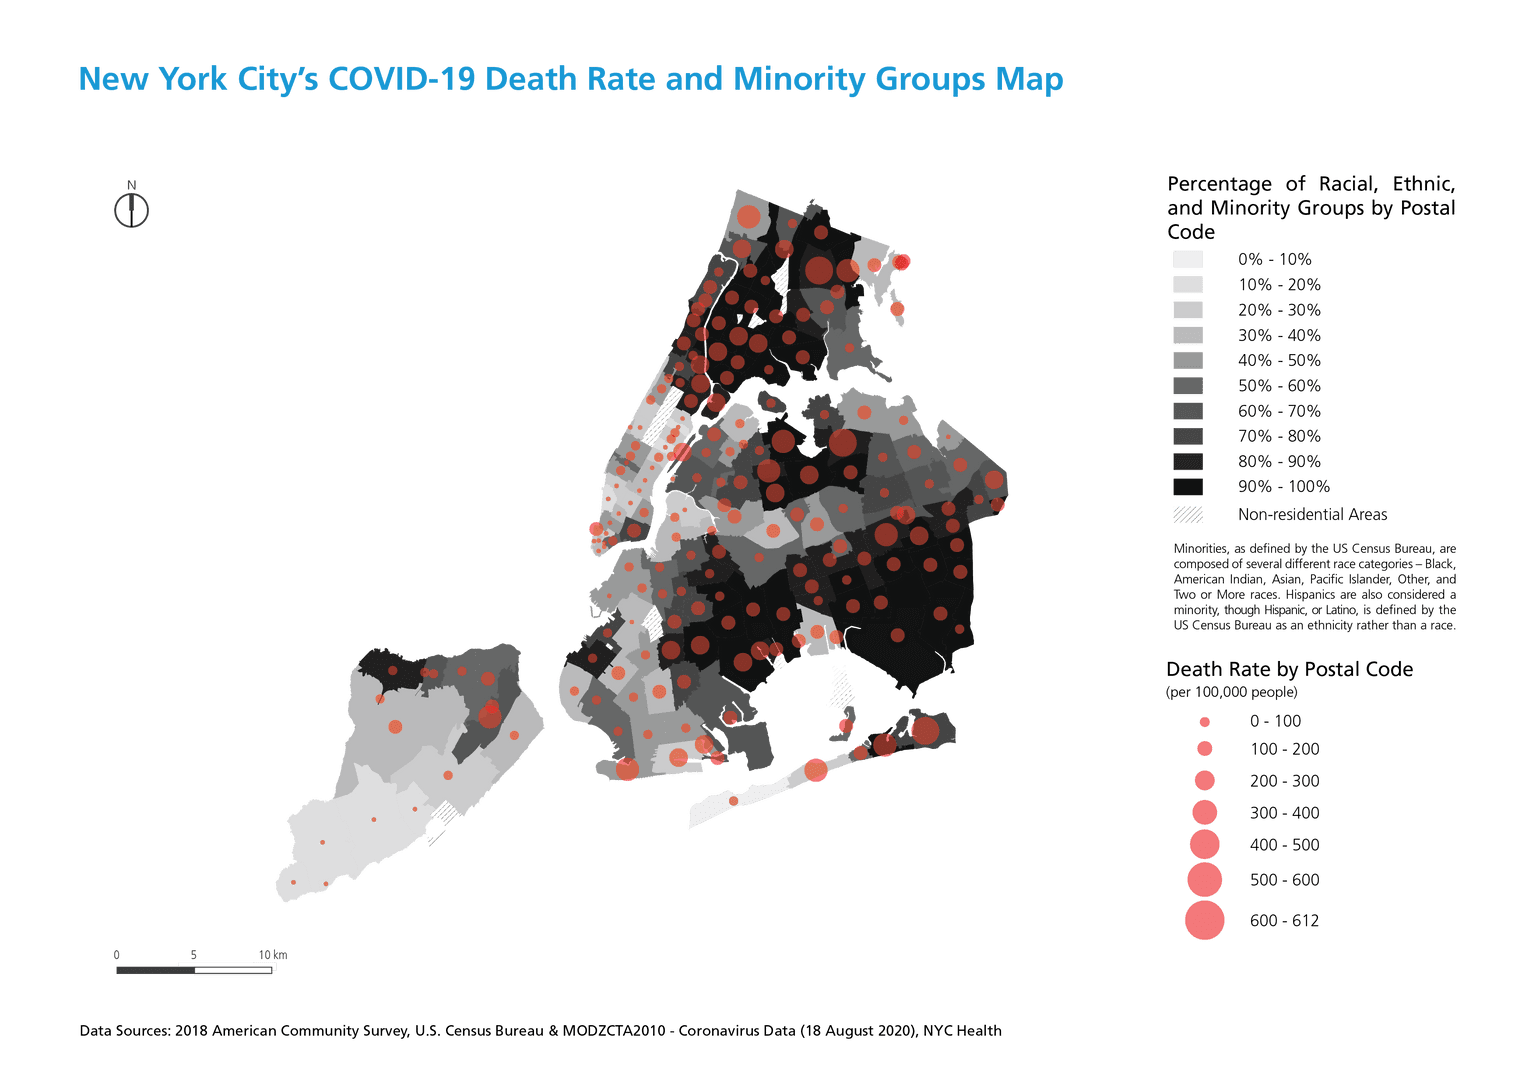
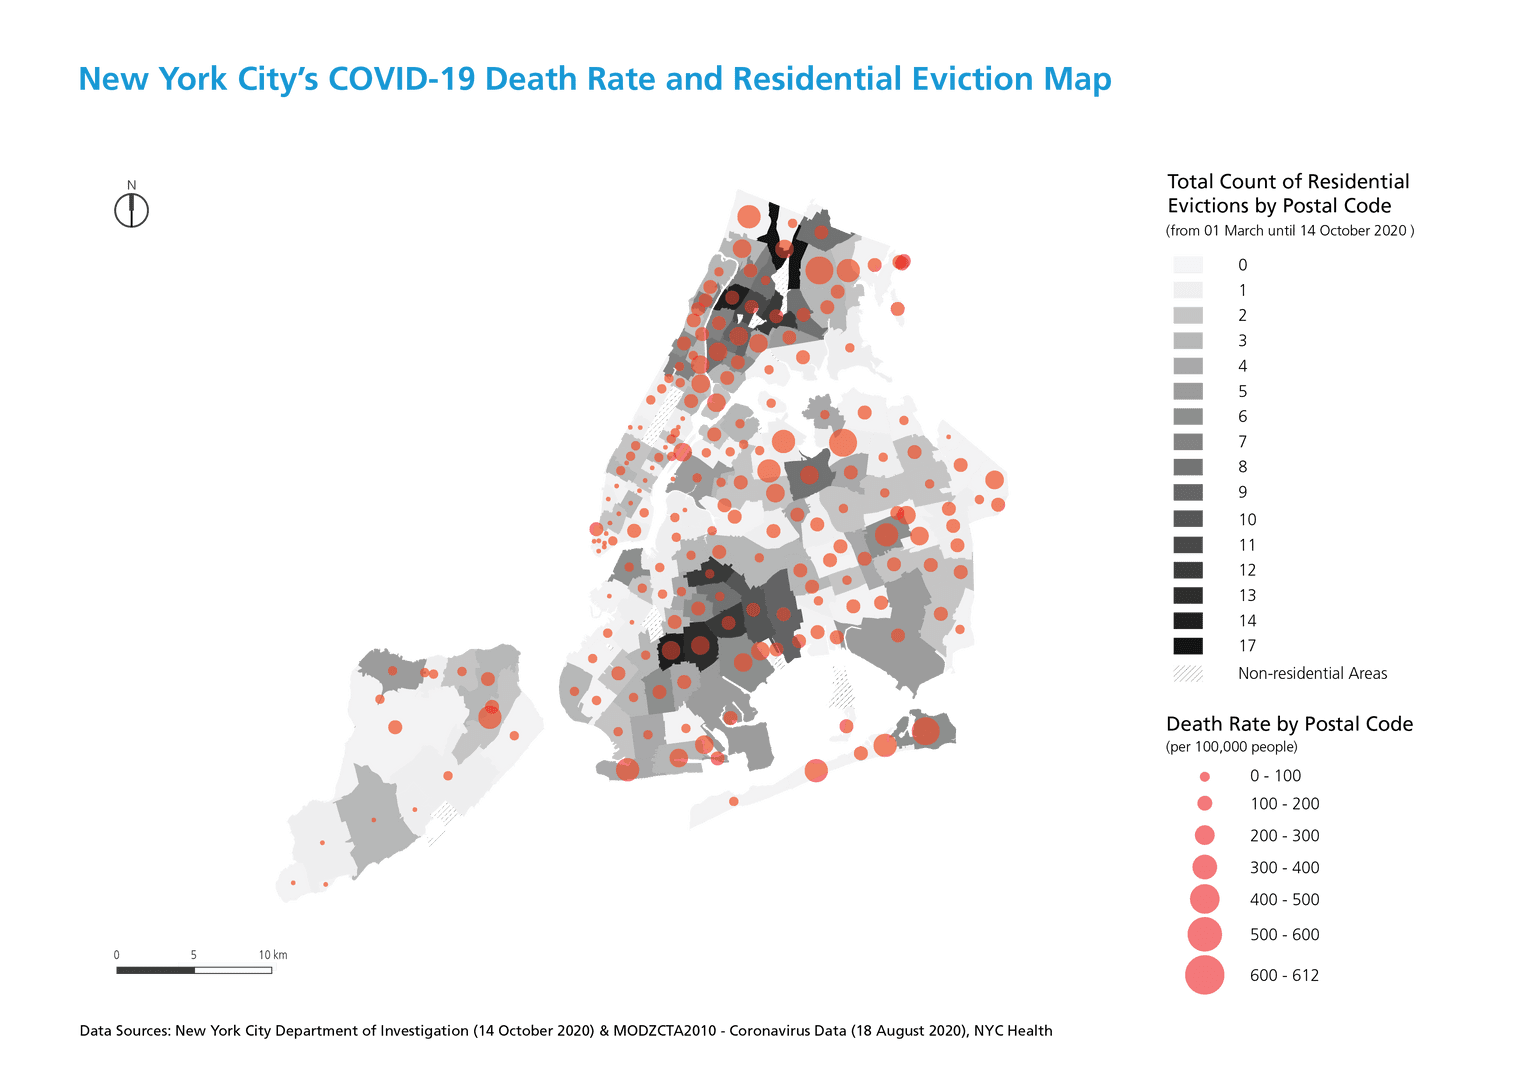
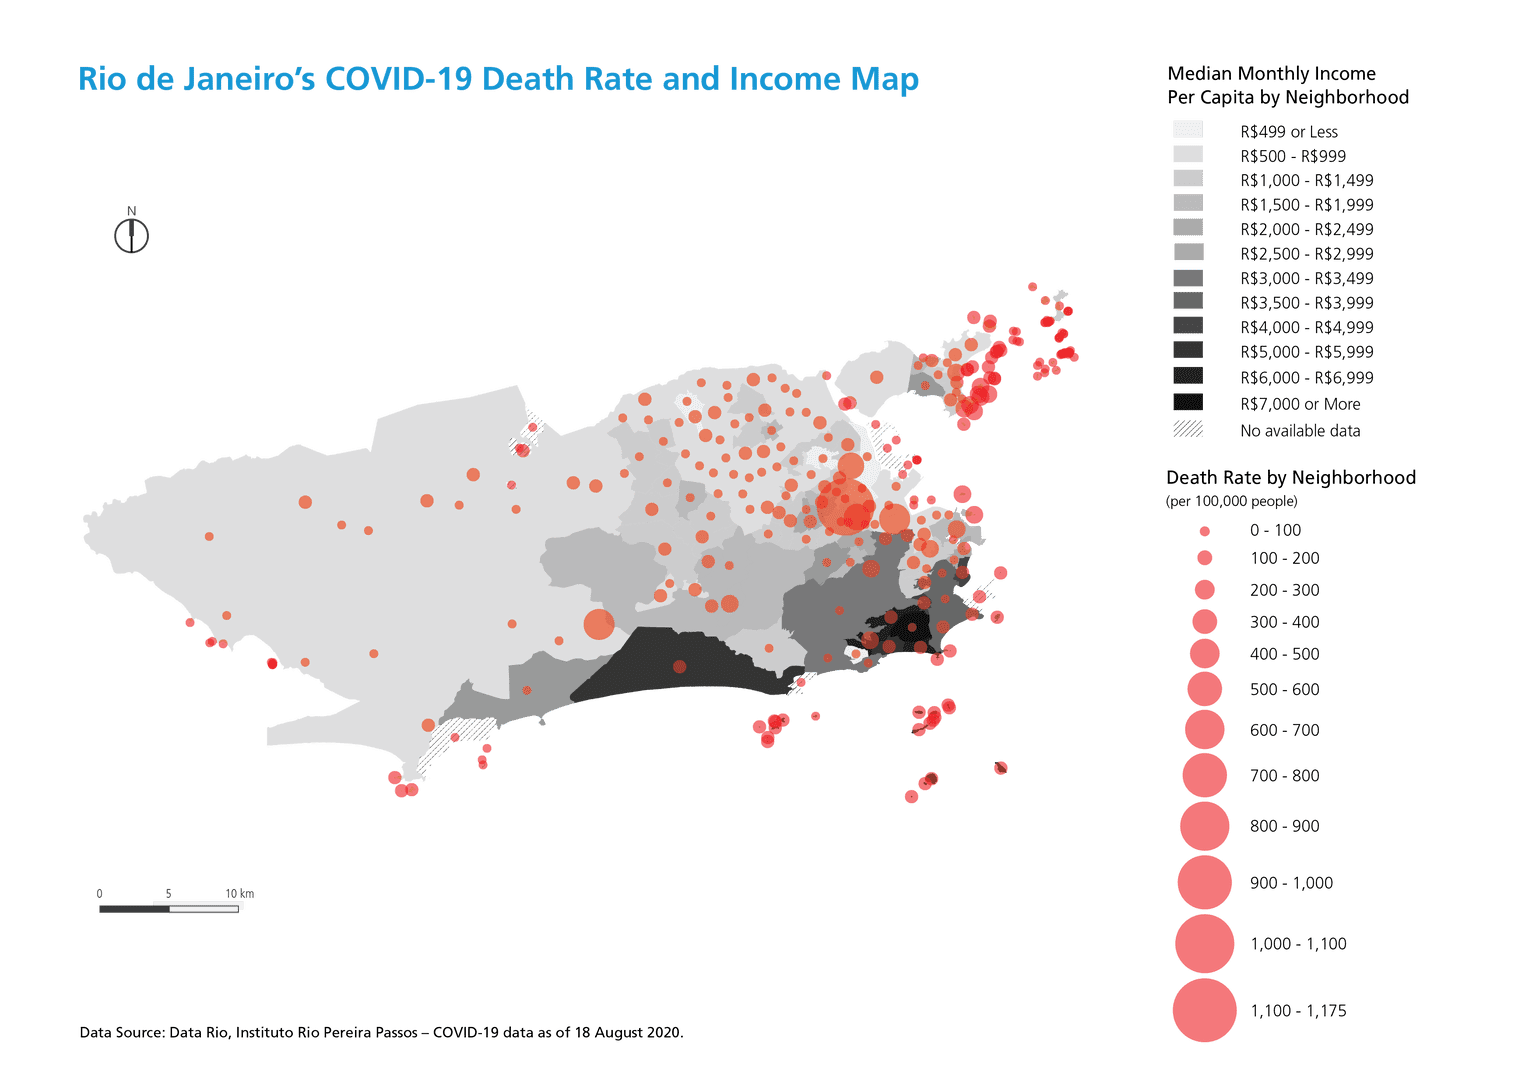
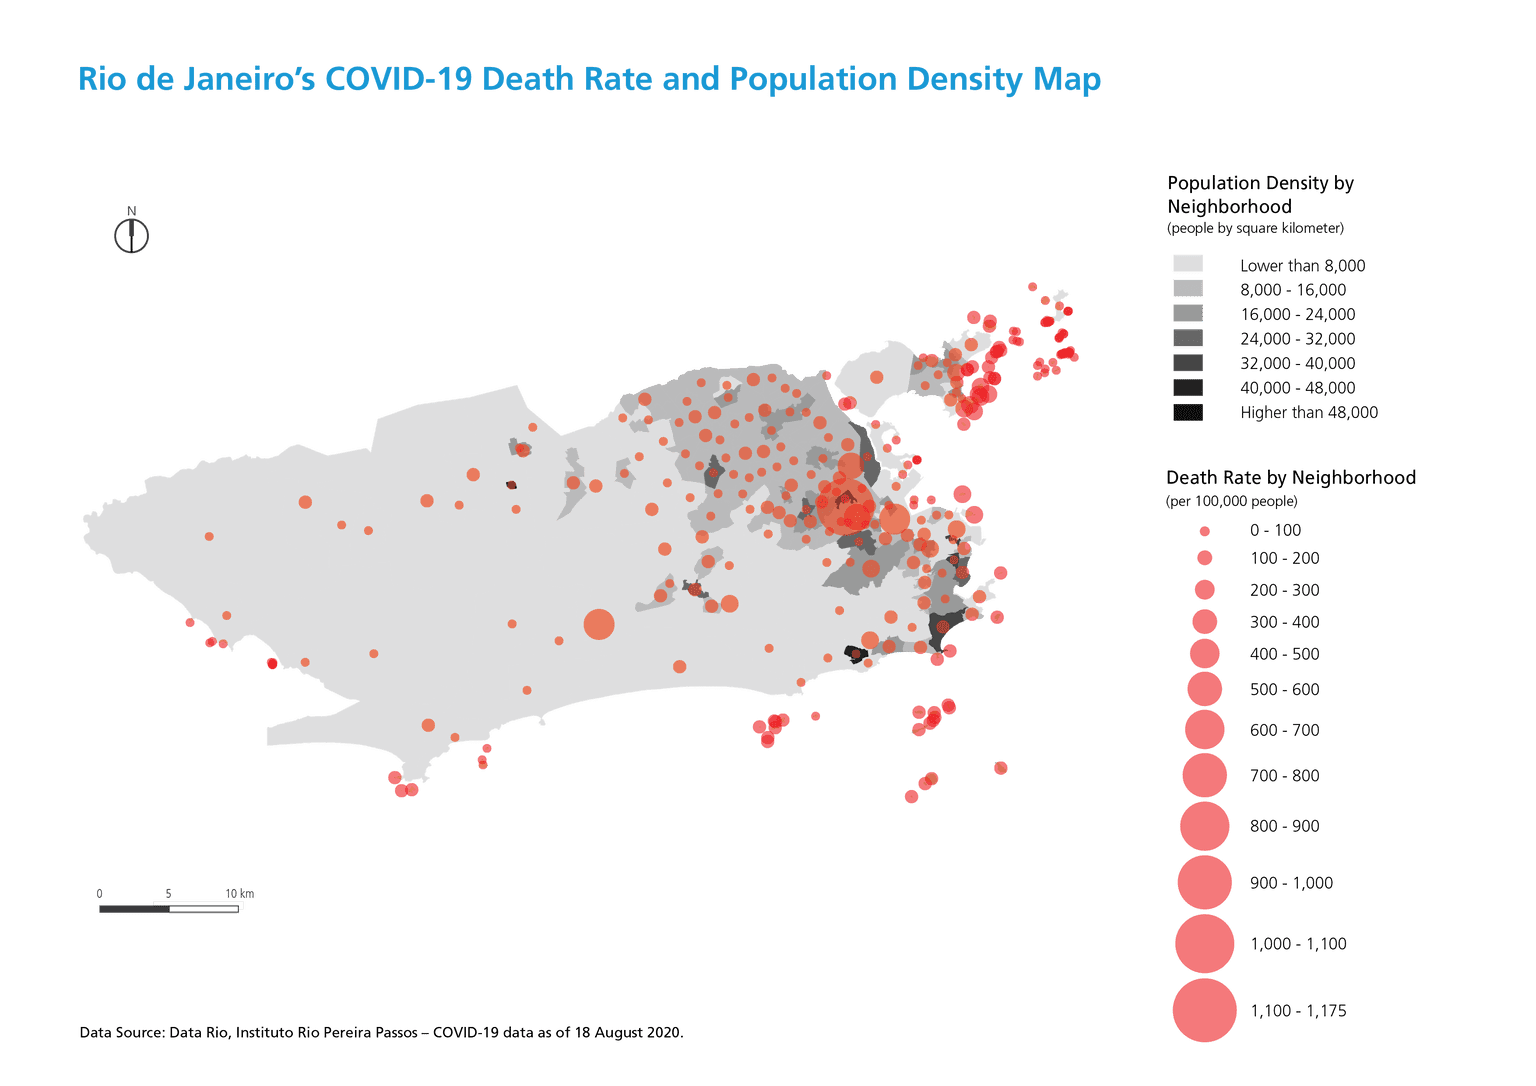
In preparation for UN-Habitat's "State of the World Cities" report, I conducted a geospatial analysis to compare social-economic data with the COVID-19 death rate in two of the world's most-affected megacities, New York City and Rio de Janeiro. Six maps, four for NYC and two for Rio De Janeiro, were created in QGIS and finalized in Adobe Illustrator. The maps compare the death rate to average income, population density, minority population, and number of residential evictions. Data was gathered from trusted governmental sources including the US Census Bureau, NYC Department of Health, and Instituto Pereira Passos.
